Test cases are run before each EA-PSM version release. Calculation results are compared to Published Examples. EA-PSM software validation is performed using L2 phase asymmetrical 5th and 3rd harmonics source, voltage drop and THD results. The difference in the results is less than 0.09% for all calculations.
System description
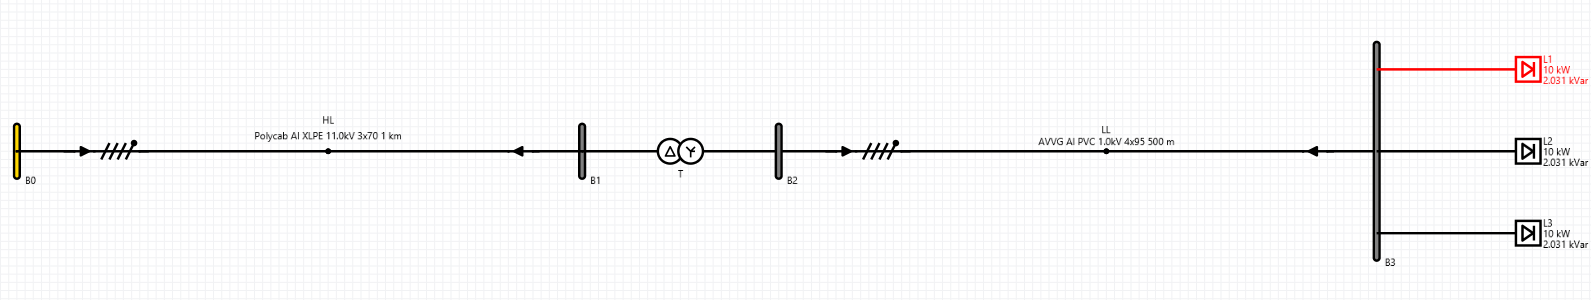
A low-voltage (UN = 400V) 3-phase system with asymmetrical loads on each phase. Load on L1 phase is disconnected while inverters L2 and L3 are generating harmonics into grid. Network contains 2 cable lines and a 10/0.4 kV transformer. The impedances of elements are given in Table 1.
Figure. 1. Validation scheme
Table 1. Element parameters
Title
Voltage level
Resistance
Reactance
System B0
10 kV
170.03 mΩ
680.13 mΩ
Cable line HL
10 kV
500.151 mΩ
129 mΩ
Transformer T
0.4 kV
18.935 mΩ
84.047 mΩ
Cable line LL
0.4 kV
185.152 mΩ
38.75 mΩ
Calculation results
Calculations for L2 phase were performed at a point of a load, at busbar “B2” and “B3”.
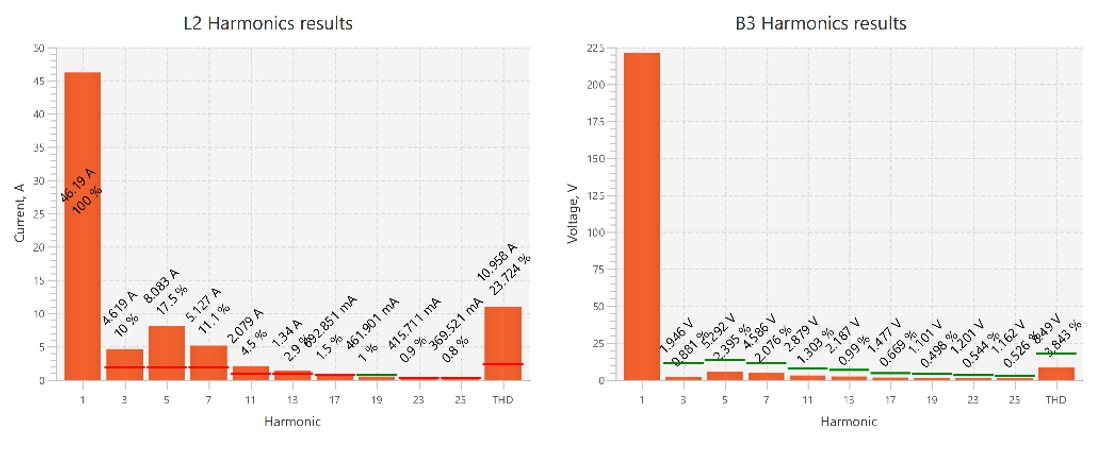
Picture 1. Generated harmonics current and voltage at busbar B3
Harmonic currents calculations:
Table 2. Harmonic currents calculations
Point
EA-PSM
Validation calculations
Difference
I, A
I, A
%
L2 3rd harmonic
0
L2 5th harmonic
0
THD calculations:
Table 3. THD comparison
Point
EA-PSM
Validation calculations
Difference
%
%
%
L2
23.724
23.733
0.04
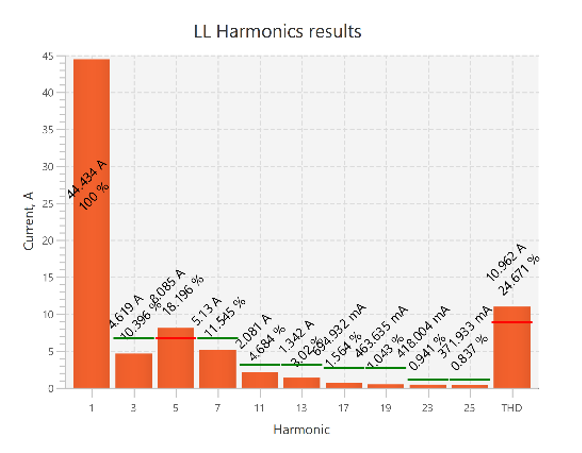
Picture 2. Harmonic currents flow through cable line “LL”
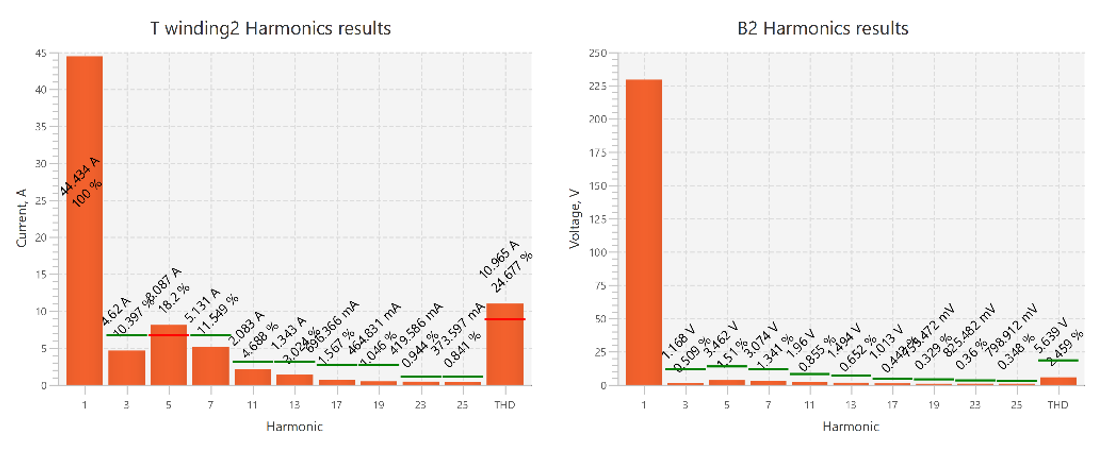
Picture 3. Harmonic currents and voltages at busbar “B2”
Voltage drop calculations of 5th harmonic in cable line “LL”:
EA-PSM
Validation
Voltage drop calculations of 3rd harmonic in cable line “LL”:
EA-PSM
Validation
Table 4. Comparison of voltage drops in cable line “LL”
Point
EA-PSM
Validation calculations
Difference
U, V
U, V
ΔU
LL 5th harmonic
LL 3rd harmonic
3rd harmonic does not flow through the transformer:
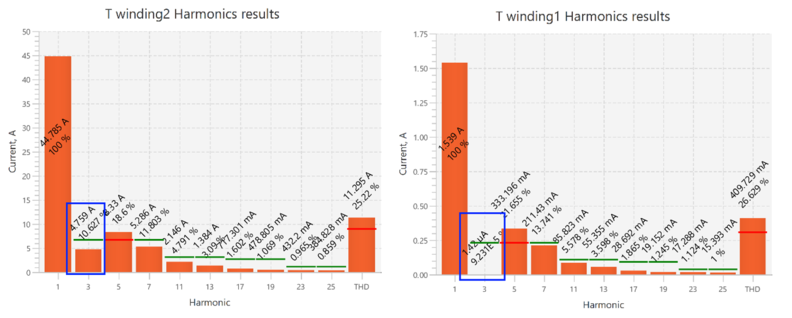
Picture 4. Harmonic flow in transformer’s high (right) and low (left) voltage windings
Conclusions
Validation calculations were performed to ensure the harmonics results in EA-PSM are correct. Difference between calculations and results of software were minimal and did not exceed 0.09%.