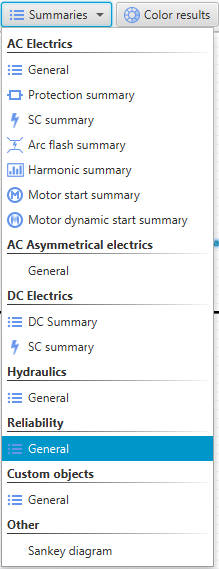
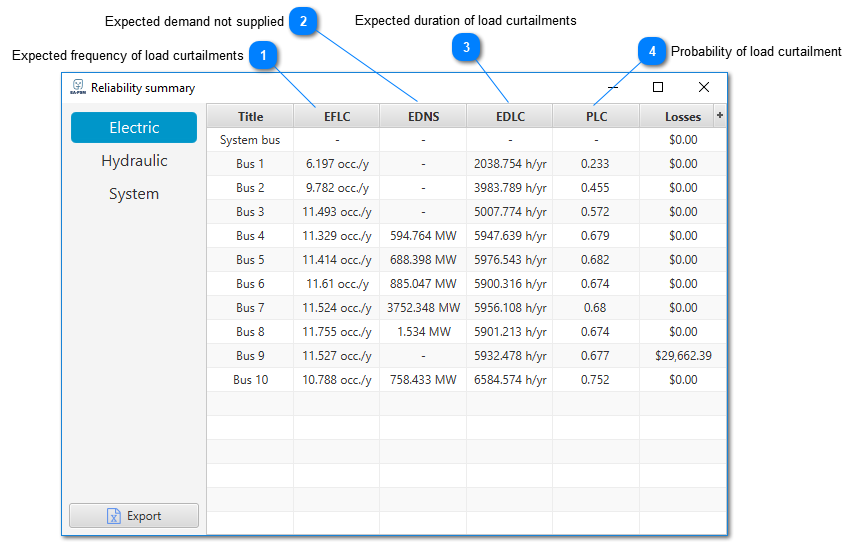
The results for the calculation can be found under the summaries section "Reliability". Hovering over the column heading will show a tooltip with the value's explanation.
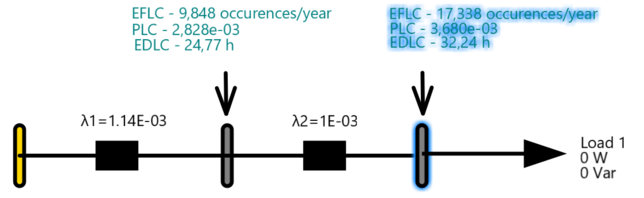
Results of EFLC, PLC and EDLC values are also visible directly on the scheme and shows results for scheme busses:
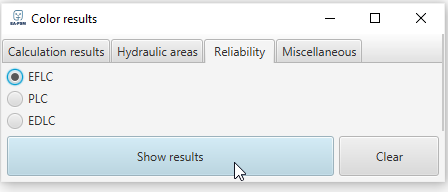
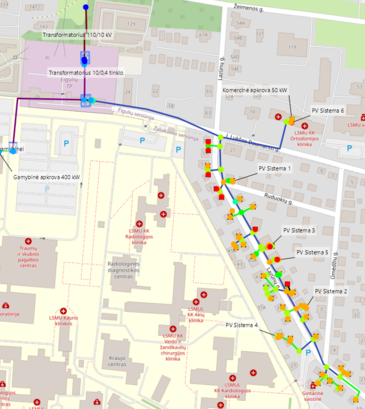
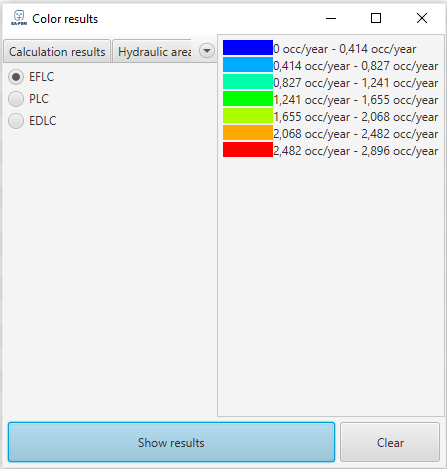
If scheme are presented on GIS, it is possible to view results of reliability calculations on the map. In order to do so, user should Open GIS module, right click anywhere on the map and select Color results , go to Reliability bar, select result and click Show results:
Under the section "System" in Reliability Summary, user can find many calculated reliability parameters, which are described as such:
SAIFI
System Average Interruption Frequency Index (interruptions/system customer/yr)
SAIDI
System average interruption duration index (hr/system customer/yr)
CAIDI
Custom average interruption duration index (hr/customer interruption)