PV Cell characteristics chart shows cells I-V characteristics which depend on irradiance and ambient temperature. To see this chart, user should perform DC Power flow calculations from Calculate → DC Electrics Tab. After performing calculations, there are two ways to open chart:
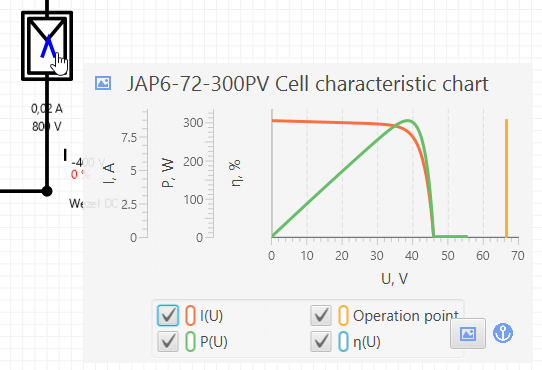
Hovering mouse cursor on DC array as described below:
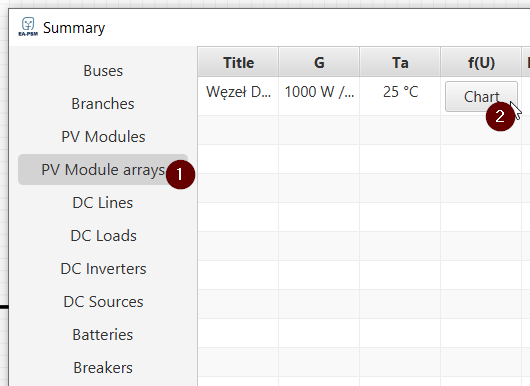
Opening PV Cell characteristic chart by selecting Summaries → DC summary and selecting PV module arrays (1) and Chart button at f(U) column (2):
At opened chart, I(U) shows current, P(U) generated power and n(U) efficiency dependancy on PV cell or PV array voltage. Operation point shows at which point modelled PV system is operating based on Inverter parameters. Read more about selecting inverter parameters here: Defining the parameters of the DC Inverter or at DC Module FAQ.