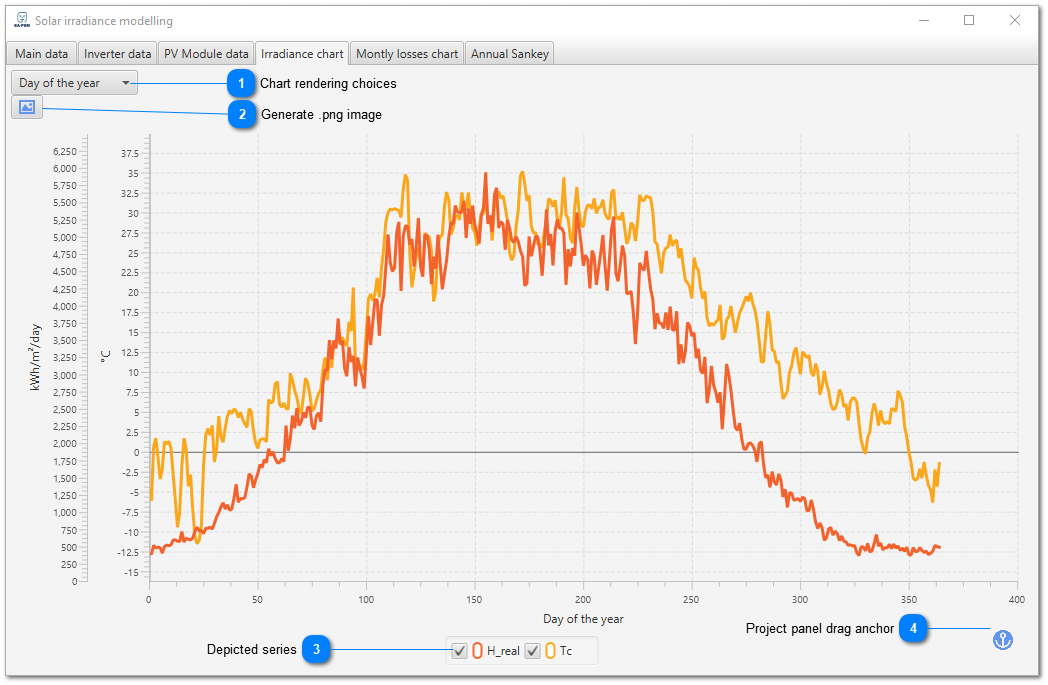
The chart can be seen in the "Irradiance chart" tab. User may choose how to depict the data over a year (hourly, daily or monthly). There is an ability to instantly capture the chart as a .png image. The chart can be dragged into the project panel (by dragging the anchor icon).