If the user has run any calculations in the main EA-PSM window, they can also be displayed in GIS data.
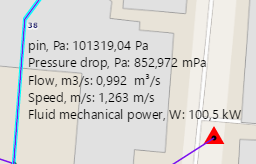
The simplest way of seeing GIS results is hovering a mouse over the objects in GIS environment. This will show all the associated results with the object.
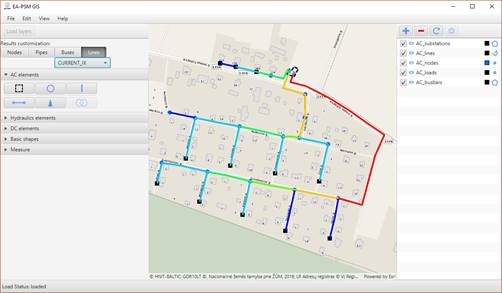
Moreover, the results can be shown as heatmaps on the map. To manage which results should be displayed as heatmaps, a new results customization bar has been added in the left side of the window. For example if the user has calculated power flows, busbar and line results can be chosen. In this case, the user has clicked the „Lines“ button and chosen the option to display „Current Ix“ from the drop-down menu. The following selection combination of selection results in the following example: line currents are displayed and the drop of current Ix can be seen as a change in color in the GIS window.
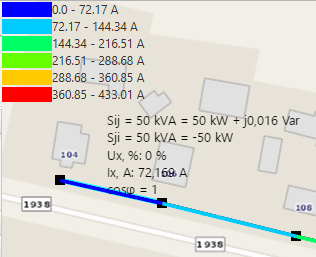
Hovering the mouse cursor over a colored graphic will also display a palette in which color and result increments associations can be seen.